Cycle Log 42

Images created with Nano Banana via Fal.ai, with prompt construction by GPT 5.2 and Gemini Thinking
ATRE: Affective Temporal Resonance Engine
A Practical System for Mapping Human Emotion and Teaching AI How Emotion Is Caused
(an explorative ‘off-white’ paper by Cameron T., organized by Chat GPT 5.2)
Introduction: Why Emotion Is the Missing Layer of the Internet
The internet is very good at storing content and very bad at understanding how that content feels.
We sort media by keywords, thumbnails, engagement graphs, and sentiment after the fact. But none of these capture the lived experience of watching something unfold in time. Humans don’t experience videos as static objects. We experience them moment by moment:
Curiosity rises.
Tension builds.
Confusion spikes.
Relief lands.
Awe appears.
Interest fades.
These transitions are real, but largely invisible to our systems.
This paper presents a system that makes emotion measurable without psychological inference, invasive profiling, or guesswork. It does so by separating measurement from learning. Emotion is first measured deterministically and probabilistically. Only then is AI introduced to learn how emotion is caused by audiovisual structure.
That separation is the core architectural principle.

The Core Idea
People react to videos in real time using emojis.
Reactions are rate-limited so each user behaves like a bounded sensor.
Reactions are aggregated into a clean emotional timeline using deterministic math.
That timeline becomes ground-truth affective data.
An AI model learns the mapping between video structure and measured emotion.
In short:
Part 1 measures emotion.
Part 2 learns emotional causality.
Why Emojis, and Why Time Is the Primary Axis
Emojis as Affective Tokens
Emojis are not language. They are affective symbols. This makes them:
cross-linguistic,
low-cognitive-load,
temporally responsive,
closer to raw feeling than explanation.
Users are not describing emotions; they are choosing them.
Time Discretization
Emotion unfolds in time. All data is aligned to a shared discrete second:
t = floor(playback_time_in_seconds)
Where:
playback_time_in_secondsis the continuous playback time of the videotis an integer second index used throughout the system
All reactions, video frames, audio features, and transcripts align to this same t, ensuring temporal consistency across modalities.
UX as Measurement Instrument (Not Decoration)
User interface design directly affects data validity. In this system, UX is part of the measurement apparatus.
Emoji Panel
Positioned beside the video player
Displays approximately 6–12 emojis at once
Emojis represent broad affective states (e.g., surprise, joy, confusion, fear, interest, boredom)
Large enough for rapid, imprecise clicking
Toggleable on/off by the user

The panel is not expressive social UI. It is a sensor interface.
Rate Limiting
Each user may submit:
At most one emoji per second
Faster inputs are discarded
Multiple clicks within a second collapse to one signal
This guarantees bounded contribution per user.
Incentives, Feedback, and Anti-Herding Design
Users are rewarded for reacting by gaining access to aggregate emotional context. After reacting, they can see how others felt and how close their reaction is to the average.
To prevent social influence:
Aggregate emotion is hidden until reaction or time elapse
Future emotional data is never shown
High-confidence moments are revealed only after they pass
Users unlock aggregate emotion for a segment only after either (1) reacting within that segment, or (2) that segment has already passed, and future segments remain hidden.
This preserves authenticity while sustaining engagement.
Part 1: Measuring Emotion Without AI
This is the foundation.

Reaction Ledger
Each reaction is stored immutably as:
(v, u, t, e, d)
Where:
v= video identifieru= anonymized user identifiert= integer second indexe= emojid = optional demographic bucket (coarse, opt-in; e.g., region, language, age band)
The ledger is append-only.
Indicator Function
I(u, t, e) = 1 if user u reacted with emoji e at second t, else 0
Where:
u= usert= second indexe= emoji
This binary function allows clean aggregation and enforces one signal per user per second.
Weighted Emoji Counts
C_t(e) = sum over users of w_u * I(u, t, e)
Where:
C_t(e)= weighted count of emojieat secondtw_u= weight of useru(initially1for all users)
The weight term allows future reliability adjustments but is neutral at initialization.
Total Participation
N_t = sum over e of C_t(e)
Where:
N_t= total number of reactions at secondt
This measures participation density.
Empirical Emotion Distribution
P̂_t(e) = C_t(e) / N_t (defined only when N_t > 0)
Where:
P̂_t(e) = empirical (unsmoothed) probability of emoji e at second t
If N_t = 0, emotion is treated as missing data, not neutrality.
Temporal Smoothing
P_t(e) = alpha * P̂_t(e) + (1 - alpha) * P_(t-1)(e)
Where:
P_t(e)= smoothed probabilityalpha∈ (0,1] = smoothing parameter
This deterministic smoothing stabilizes noise and fills gaps without learning.
Entropy (Agreement vs Confusion)
H_t = - sum over e of P_t(e) * log(P_t(e))
Where:
H_t= Shannon entropy at secondt
Low entropy indicates agreement; high entropy indicates emotional dispersion.
Normalized Entropy
H_t_norm = H_t / log(number_of_emojis)
This rescales entropy to the range [0,1], making it comparable across emoji sets.
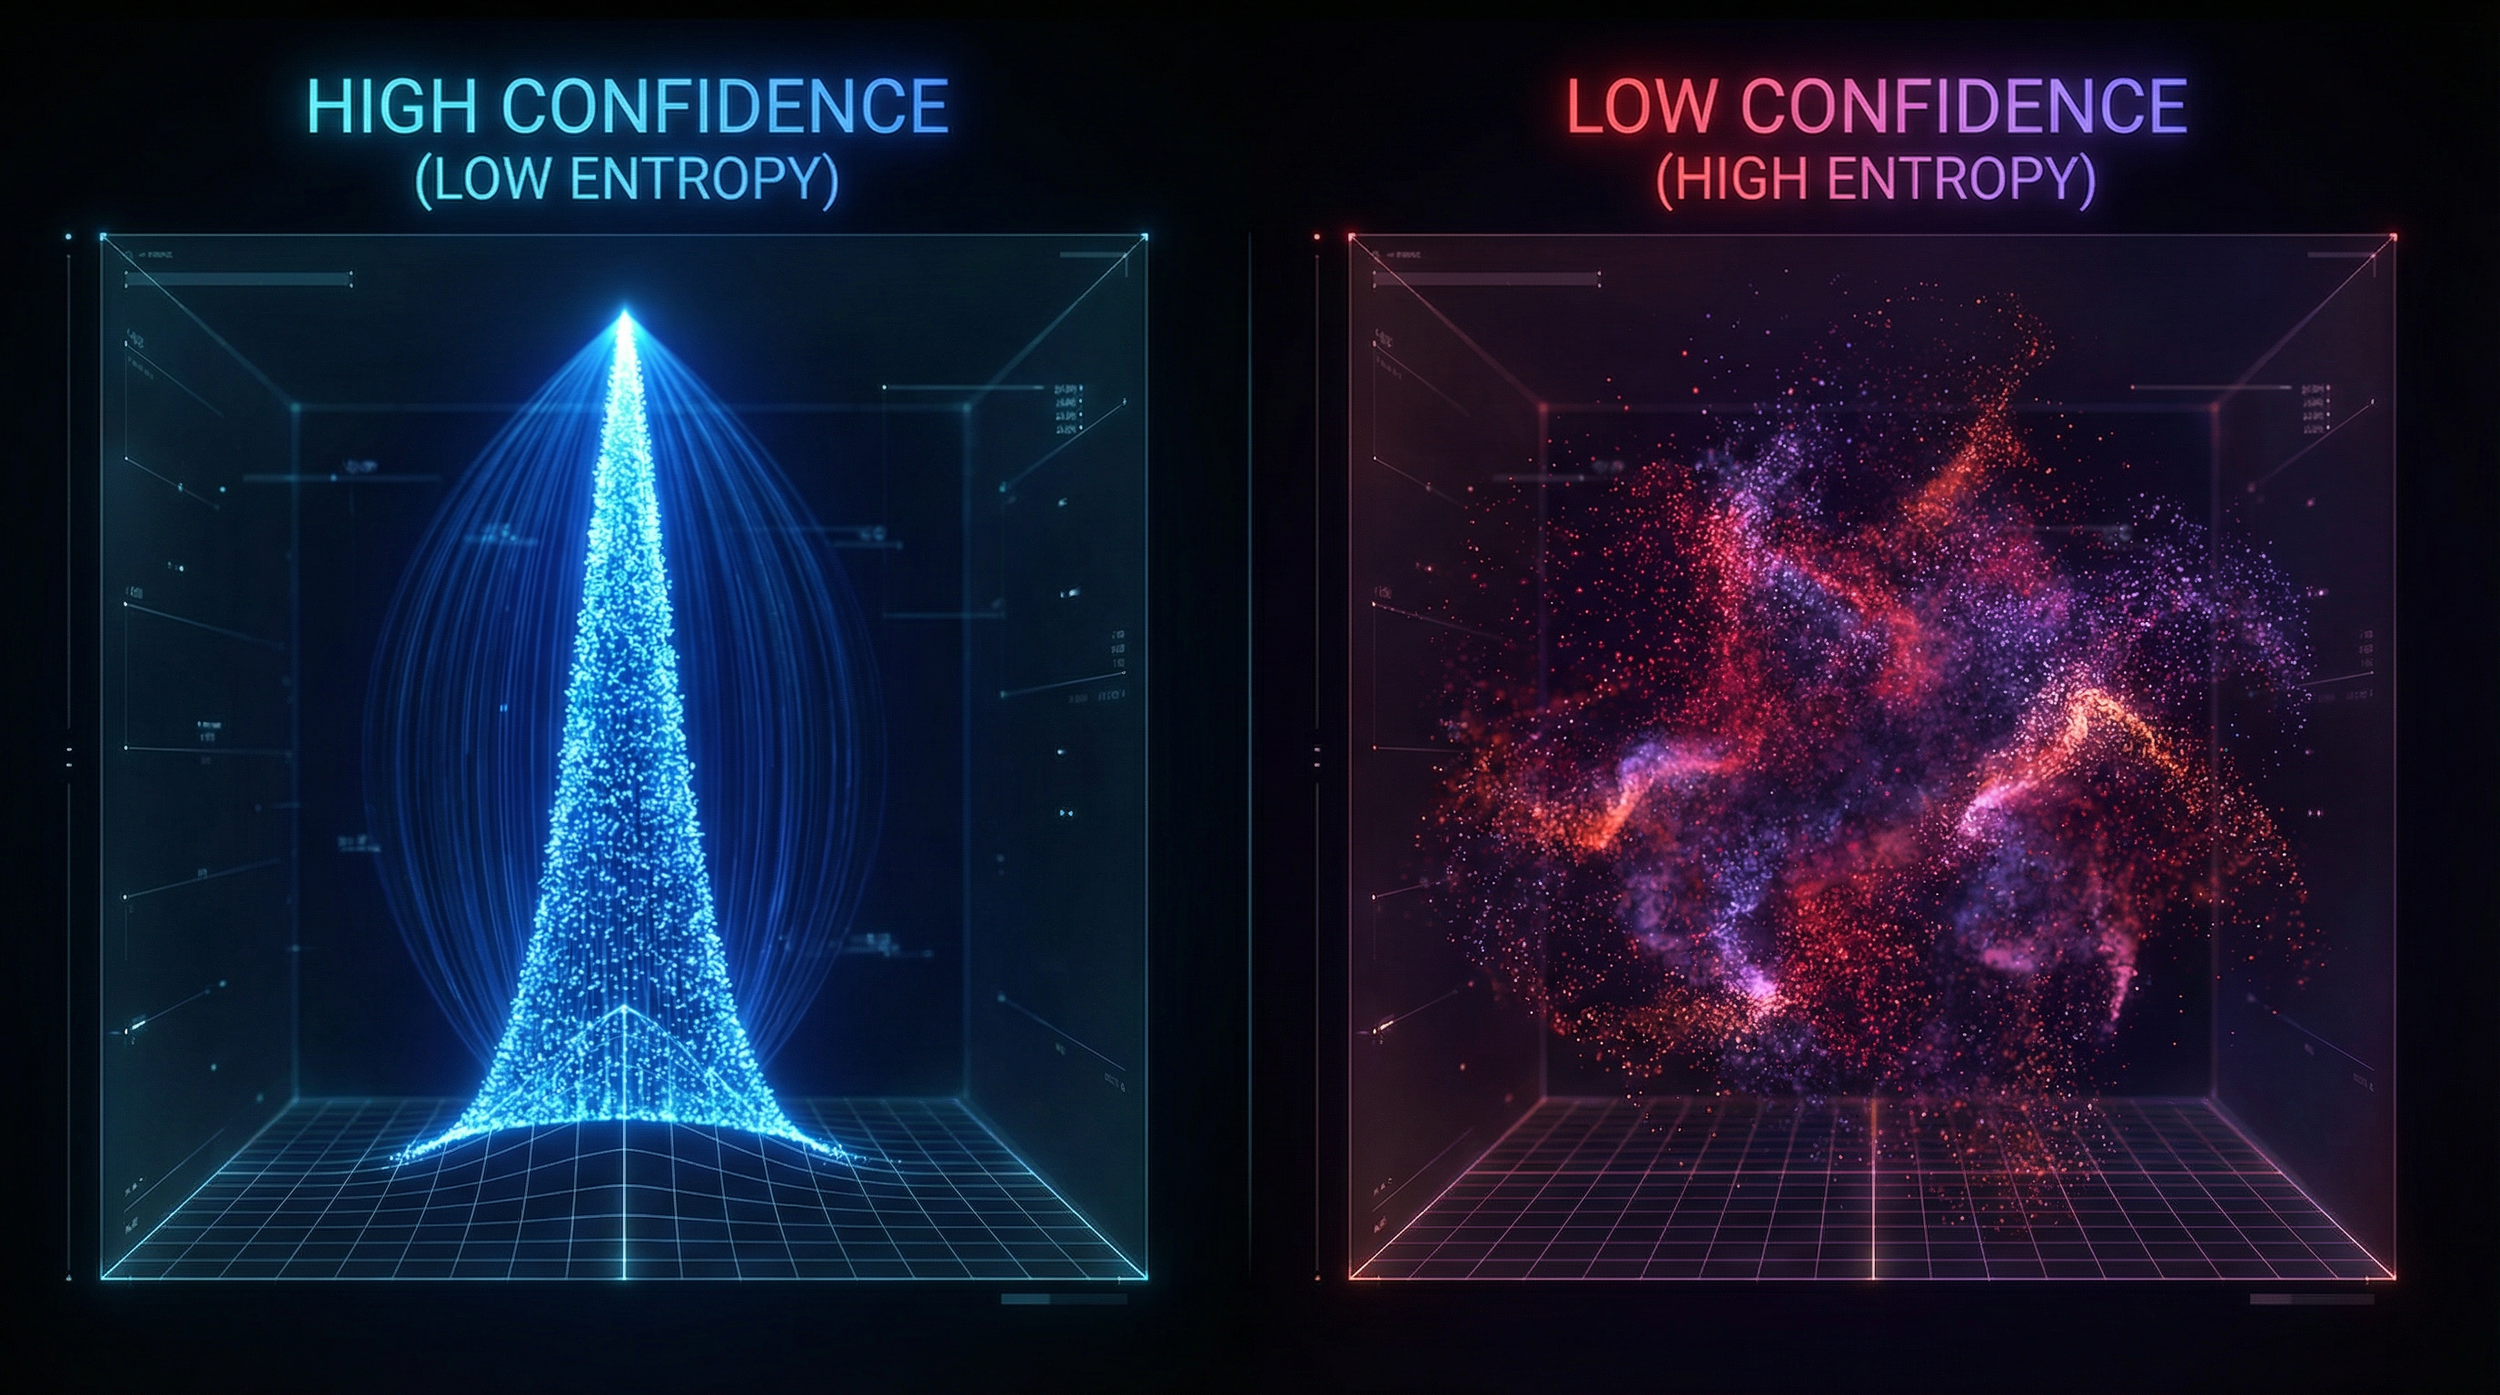
Confidence Score
conf_t = sigmoid(a * log(N_t) - b * H_t_norm)
Where:
conf_t= confidence in emotion estimate at secondta,b= calibration constantssigmoid(x) = 1 / (1 + e^(-x))
Confidence increases with participation and agreement, decreases with disagreement.
Demographic Conditioning
P_t(e | d) = C_t(e | d) / sum over e of C_t(e | d)
Where:
d= demographic bucket
Divergence between groups:
Pol_t(d1, d2) = JSD(P_t(.|d1), P_t(.|d2))
This measures difference, not correctness.
Output of Part 1
For each second t:
emotional distribution
P_t(e)confidence
conf_tentropy
H_t_normoptional demographic divergence
This is measured collective emotion.
Why This Must Not Be AI
Training directly on raw clicks confounds emotion with UI behavior, participation bias, and silence. Measurement must be stable before learning, otherwise the model learns who clicks, not what people felt.
Part 2: Teaching AI How Emotion Is Caused
Model Definition
f(X_t) → Ŷ_tWhere:
X_t= audiovisual features at secondtŶ_t= predicted emotional state
Inputs
X_t includes:
visual embeddings
audio embeddings
music features
speech prosody
pacing and cuts
All aligned to t.
Outputs
Ŷ_t includes:
predicted emoji distribution
predicted entropy
predicted confidence
Loss Function
L_emo = sum over t of conf_t * sum over e of P_t(e) * log(P_t(e) / P_model,t(e))
Where:
P_t(e) = measured emotion distribution from Part 1 at second t
P_model,t(e) = Model 2 predicted emotion distribution at second t
This is a confidence-weighted KL divergence. Low-confidence moments contribute less to learning.
Emotional Timelines for Any Video
What this means
Once Model 2 is trained, emotional understanding no longer depends on humans reacting in real time. The system can ingest any video—older YouTube uploads, archived films, educational content, or raw footage—and infer a second-by-second emotional distribution.
Technically, this process works as follows:
The video is decomposed into temporally aligned audiovisual features.
Model 2 predicts the emotional probability distribution P_t(e) at every second.
Confidence and entropy are inferred even when no human reactions are present.
This effectively backfills the emotional history of the internet, allowing emotion to be inferred for content created long before the system existed.
What this enables
Every piece of media becomes emotionally indexable.
Emotional structure becomes an intrinsic property of content rather than a byproduct of engagement.
Emotional arcs can be compared across decades, genres, and platforms.
Emotion stops being ephemeral. It becomes metadata.
What it feels like
You scrub through a ten-year-old science video with zero comments. As you hover over the timeline, you see a subtle rise in curiosity at 1:42, a spike of confusion at 3:10, and a clean emotional resolution at 4:05.
You realize this is why people kept watching, even though no one ever talked about it.
Emotional Search
What this means
Instead of searching by text, tags, or titles, content can be discovered by emotional shape.
The system supports queries such as:
Videos that build tension slowly and resolve into awe.
Moments that cause confusion followed by relief.
Clips that reliably evoke joy within a few seconds.
Under the hood:
Emotional timelines are embedded as vectors.
Similarity search is performed over emotional trajectories rather than words.
Queries can be expressed symbolically using emojis, numerically as curves, or in natural language.
What this enables
Discovery becomes affect-driven rather than SEO-driven.
Creators find reference material by feel instead of genre.
Viewers find content that matches their internal state, not just their interests.
This introduces a fundamentally new retrieval axis.
What it feels like
You are not sure what you want to watch. You only know you want something that feels like gentle curiosity rather than hype.
You draw a simple emoji curve—🙂 → 🤔 → 😌—and the system surfaces a handful of videos that feel right, even though you have never heard of the creators.

Creator Diagnostics
What this means
Creators gain access to emotion-aware analytics rather than relying solely on retention graphs.
Instead of seeing:
“People dropped off here”
They see:
Confusion spiked at this moment.
Interest flattened here.
This section polarized audiences.
This reveal worked emotionally, not just statistically.
Technically:
Emotional entropy highlights ambiguity or overload.
Confidence-weighted signals identify reliable emotional moments.
Polarization metrics reveal demographic splits.
What this enables
Editing decisions guided by human emotional response rather than guesswork.
Faster iteration on pacing, explanations, and narrative reveals.
Reduced reliance on clickbait or artificial hooks.
Creators can finally diagnose why something did not land.
What it feels like
You notice a drop in engagement at 2:30. Instead of guessing why, you see a sharp rise in confusion with low confidence.
You do not add energy or spectacle. You clarify one sentence.
On the next upload, the confusion spike disappears, and retention follows.
Cross-Cultural Insight
What this means
Because the underlying signal is emoji-based and probabilistic, emotional responses can be compared across cultures and languages without translation.
Technically:
Emotional distributions are computed for each demographic slice.
Jensen–Shannon divergence measures where groups differ.
Shared emotional structure emerges even when interpretation varies.
This reveals:
Universal emotional triggers.
Culture-specific sensitivities.
Age-based tolerance for complexity, tension, or ambiguity.
What this enables
Global creators understand how content travels emotionally across audiences.
Researchers study emotion without linguistic bias.
Media analysis becomes comparative rather than anecdotal.
Emotion becomes a shared coordinate system.
What it feels like
You overlay emotional timelines from three regions on the same video.
The moment of surprise is universal.
The moment of humor splits.
The moment of discomfort appears only in one group.
You see, visually rather than theoretically, how culture shapes feeling.
Generative Emotional Control
What this means
Emotion is no longer only an output. It becomes a control signal.
Instead of prompting a system with vague instructions like “make a dramatic scene,” creators specify:
An emotional arc.
A target entropy profile.
A desired resolution pattern.
Technically:
Emotional timelines act as reward functions.
Generative systems are optimized toward affective outcomes.
Structure, pacing, and content are adjusted dynamically.
What this enables
AI-generated media that feels intentional rather than random.
Storytelling guided by measured human emotional response rather than token likelihood.
Safer and more transparent emotional shaping.
This is emotion-aware generation, not manipulation.
What it feels like
You upload a rough cut and sketch a target curve:
calm → curiosity → tension → awe → rest.
The system suggests a pacing adjustment and a musical shift.
When you watch the revised version, it does not feel AI-made.
It feels considered.
Affective Alignment Layer
What this means
The system becomes a bridge between human experience and machine understanding.
Instead of aligning AI systems using:
text preferences,
post-hoc ratings,
abstract reward proxies,
they are aligned using:
measured, time-aligned human emotional response,
with uncertainty and disagreement preserved.
Technically:
Emotional distributions serve as alignment signals.
Confidence gating prevents overfitting to noisy data.
Emotion remains inspectable rather than hidden.
What this enables
AI systems that understand impact rather than intent alone.
Improved safety through transparency.
A grounding layer that respects human variability.
This is alignment through observation, not prescription.
What it feels like
You watch an AI-generated scene while viewing its predicted emotional timeline alongside your own reaction.
They are close, but not identical.
The difference is not a failure.
It is a conversation between human experience and machine understanding.
Why This Matters
Taken together, these capabilities transform emotion into:
a measurable field,
a searchable property,
a creative control surface,
and an alignment signal.
Not something guessed.
Not something exploited.
Something observed, shared, and understood.
That is what a fully trained system enables.
On the Full Power Surface of This System
It is worth stating plainly what this system is capable of becoming if its boundaries are ignored, relaxed, or allowed to erode over time. Any system that can measure human emotional response at scale, aligned in time and across populations, naturally sits close to mechanisms of influence. That proximity exists regardless of intent.
If unconstrained, the system does not suddenly change character. It progresses. Measurement becomes anticipation. Anticipation becomes optimization. Optimization becomes structure. At that point, emotion is no longer only observed. It becomes a variable that can be adjusted. The distinction between understanding emotional response and shaping it becomes increasingly difficult to locate.
One reachable configuration of the system does not stop at collective modeling. With sufficient temporal resolution and data density, stable affective tendencies begin to emerge naturally. Even without explicit identifiers, time-aligned emotional data supports pattern recognition at the individual level. What begins as “most viewers felt confused here” can drift toward “this viewer tends to respond this way to this type of stimulus.” At that point, emotion stops functioning as a shared field and begins to function as a personal lever.
At population scale, emotional response can also become a performance metric. Content need not be optimized for clarity, coherence, or accuracy. It can be optimized for emotional efficiency. Structures that reliably produce strong, low-ambiguity reactions rise. Structures that require patience, ambiguity, or reflection become less competitive. Emotional arcs can be engineered to condition rather than inform. This outcome does not require malicious intent. It follows directly from optimization pressure.
The system also enables the comparison of emotional response across demographic groups. If treated diagnostically, this reveals how different audiences experience the same material. If treated as a target, it becomes a map of emotional susceptibility. Differences in tolerance for uncertainty, pacing, or affective load can be used to tune narratives differently for different populations. Once emotion is measured, it can be segmented.
There is also a convergence effect. When emotional response is treated as success, content tends toward what produces clean, legible reactions. Ambiguity becomes expensive. Silence becomes inefficient. Subtle emotional states become harder to justify. Over time, this shapes not only the content produced, but the instincts of creators and systems trained within that environment.
At the extreme end of the capability surface, the architecture supports real-time emotional steering. Not through explicit commands, but through small adjustments to pacing, framing, and timing that nudge large groups toward predictable emotional states. Influence in this regime does not announce itself as influence. It presents as coherence or inevitability. Things simply feel like they make sense.
None of these outcomes require secrecy, hostility, or deliberate misuse. They arise naturally when emotional measurement is coupled tightly to optimization under scale. The system itself does not choose which of these configurations emerges. That outcome is determined by how it is used.
Training Timeline and Data Acquisition Strategy
This section addresses the practical reality underlying the system described so far: how long it takes to collect sufficient data for each part of the architecture, and how that data is acquired without violating the opt-in, measurement-first principles of the system.
It is important to distinguish between the 2 phases clearly. Part 1 is not trained in the machine learning sense. It is constructed deterministically and becomes useful as data accumulates. Part 2 is trained, and its progress depends on the volume, quality, and diversity of emotionally labeled video seconds produced by Part 1.
The timelines that follow therefore describe 2 parallel processes: the accumulation of emotionally grounded data, and the convergence of a model trained to learn emotional causality from that data.
Defining “Trained” for Each Part
Part 1 does not converge. It stabilizes.
Its outputs improve as reaction density increases, as smoothing becomes more reliable, and as confidence scores rise on emotionally active segments. The relevant question is not whether Part 1 is finished, but whether enough reactions exist for emotional distributions to be meaningful rather than noisy.
Part 2 converges in the conventional sense. Its performance depends on how many seconds of video have reliable emotional ground truth, weighted by confidence and agreement.
These 2 clocks run at different speeds. Data accumulation governs the first. Model optimization governs the second.

Selecting Videos and Creators for Early Data Collection
The system benefits disproportionately from content in the top 5% of engagement within a platform. For practical purposes, the initial target is approximately the top 5% of videos by engagement within their respective categories.
This class of content offers 2 advantages. First, audiences are already accustomed to reacting emotionally and rapidly. Second, the emotional structure of these videos is pronounced: clear build-ups, reveals, reversals, and resolutions occur in tight temporal windows.
Early-stage data collection favors formats with synchronized emotional response across viewers. Examples include high-energy challenge content, reveal-driven narratives, science build videos with visible payoff moments, illusion and magic reveals, horror clips, competitive highlights, and tightly paced storytelling formats.
Slower formats such as long-form podcasts, lectures, ambient content, or subtle arthouse material contain meaningful emotional structure, but reactions are less synchronized and sparser. These formats become valuable later, once Part 2 can infer emotion without dense human input.
Reaction Density Requirements for Stable Emotional Measurement
Part 1 produces an emotional distribution for each second of video. These distributions become interpretable only when enough reactions occur within the same temporal window.
When reaction counts per second are very low (0–5), emotional estimates are fragile and confidence should remain low. As reaction counts rise into the 10–25 range, patterns become visible. When counts reach 50–100+ on emotionally active seconds, demographic slicing and divergence analysis become meaningful.
Importantly, the system does not require dense reactions on all 600 seconds of a 10-minute video. Human emotional synchronization occurs naturally around moments of change: reveals, surprises, punchlines, corrections, and completions. These moments carry the majority of emotional signal.
For an initial deployment, a practical target is to achieve average reaction counts in the range of 10–25 on emotionally active seconds, with higher counts on peak moments. This is sufficient to produce usable emotional timelines with appropriate confidence weighting.
Converting Views Into Reactions
The primary constraint on data collection is not views but reactions. Reaction volume is governed by a chain of probabilities: how many viewers are exposed to the reaction interface, how many opt in, how many actively react, and how frequently they do so.
Early-stage opt-in rates among exposed viewers are realistically in the 0.2%–2% range. Among those who opt in, approximately 20%–60% will actively react. Active reactors typically produce bursts of emoji input during emotionally salient moments rather than continuous clicking.
A typical active reactor produces approximately 40–120 reactions over a 10-minute video, concentrated around moments of change rather than evenly distributed in time.
This bursty pattern is not a defect. It reflects how emotion is actually experienced.

Required Reactor Counts Per Video
Because emotional density is required primarily at moments of synchronization, the system does not require thousands of reactors per video to function.
For a 10-minute video with approximately 100 emotionally active seconds, achieving an average of 25 reactions per active second requires roughly 2,500 total reactions concentrated in those moments.
If each active reactor contributes approximately 60 reactions, this corresponds to roughly 42 active reactors per video for a minimum viable emotional map. For higher-confidence maps with 75 reactions per active second on peaks, approximately 125 active reactors are required.
These numbers are well within reach for high-view-count content when the interface is visible and the feedback loop is compelling.
Minimum Viable Dataset for Training Part 2
Part 2 learns from labeled seconds, not labeled videos. The relevant unit of scale is therefore total seconds of video with reliable emotional distributions.
A practical minimum for a first generalizable model is approximately 1–3 million labeled seconds. This corresponds roughly to 300–1,000 videos of 10 minutes each for early specialization, or 2,000–10,000 videos for broader generalization across formats.
Early specialization within a small set of high-signal categories allows the model to learn clear emotional cause-and-effect relationships before being exposed to subtler content.
As coverage expands across genres, pacing styles, and cultures, the model’s ability to generalize improves. Part 1 continues to accumulate data even as Part 2 is retrained.
Expected Time Scales
An initial pilot phase lasting 2–4 weeks is sufficient to validate the full pipeline on 20–50 videos and tune the emoji set, smoothing parameters, confidence calibration, and anti-herding mechanics.
A minimum viable data layer capable of supporting a first functional emotional inference model can be achieved within 1–3 months, assuming consistent exposure to high-engagement content and modest opt-in rates.
Broader generalization across content types and demographics emerges over an additional 3–9 months as 2,000–10,000 videos are incorporated. At this stage, emotional search and creator diagnostics become meaningfully reliable across genres.
A mature system capable of robust inference across long-tail formats and nuanced emotional structures emerges on the order of 9–18 months, driven more by data diversity than by model complexity.
Model Training Time
Once sufficient labeled data exists, model training is comparatively straightforward. Leveraging pretrained audiovisual encoders and fine-tuning on emotionally grounded targets allows initial models to converge in hours to days. Larger-scale retraining cycles occur over days to weeks as data volume grows.
Iteration speed matters more than raw compute. Frequent retraining allows the model to adapt as measurement quality improves and prevents it from learning artifacts of early UI behavior.
Opt-In Deployment as a Data Advantage
Opt-in is treated as a feature rather than a limitation. Users opt in because the emotional overlay is informative and engaging. Creators opt in because the diagnostics provide insight unavailable through traditional analytics.
Initial deployment favors browser extensions or companion overlays that integrate with existing platforms. The reward loop is immediate: reacting unlocks emotional context. This sustains participation without coercion.
Creators can accelerate data accumulation by explicitly inviting audiences to participate, particularly for content designed around reveals or narrative beats.
When Model 2 Becomes Worth Training
A practical threshold for initiating Part 2 training is the presence of several hundred videos with consistently dense reactions on emotionally active seconds.
When peak moments reliably reach 50+ reactions per second for multiple seconds at a time, the signal-to-noise ratio is sufficient for meaningful learning. Training before this point risks teaching the model UI behavior rather than emotional causality.
Scaling Strategy
The system scales by first mastering emotionally legible content and then expanding outward. Dense human reactions seed the model. The model then backfills emotion for content where reactions are sparse or absent.
This laddered approach allows the system to grow without fabricating emotion or guessing prematurely.
Conclusion: Emotion as a Field, Not a Guess
What this paper describes is not a new recommendation system, a sentiment classifier, or a psychological model. It is a change in how emotion is treated by machines and platforms in the first place.
Today, emotion on the internet is inferred indirectly. We look at clicks, watch time, likes, comments, and post-hoc sentiment analysis and try to work backward. We guess how something felt based on behavior that is several steps removed from the actual experience. This approach is noisy, biased toward extremes, and fundamentally blind to what happens moment by moment as content unfolds.
ATRE inverts that process.
Instead of guessing emotion after the fact, it measures it as it happens. Instead of compressing feeling into a single score, it preserves emotional structure over time. Instead of teaching AI what to say and hoping it lands, it teaches AI how emotion is caused by pacing, sound, imagery, and structure.
That difference unlocks an entirely new class of capabilities.
On the constructive side, it enables emotional timelines for any piece of media, including legacy content that never had social engagement. It allows emotion to become searchable, comparable, and analyzable in the same way we currently treat text or visuals. It gives creators a way to understand why something worked or didn’t, rather than relying on vague retention curves or intuition. It allows AI systems to generate media with intentional emotional arcs rather than probabilistic imitation. It provides a concrete alignment signal grounded in real human experience instead of abstract reward proxies.
At the same time, the same machinery can be pointed in other directions. Emotional response can become a performance metric. Emotional divergence can become a targeting surface. Emotional efficiency can replace meaning as an optimization goal. Emotional steering can emerge simply by tightening feedback loops and letting selection pressure do the rest. None of these outcomes require bad actors or hidden intent. They fall out naturally when emotional measurement is coupled directly to optimization at scale.
The system itself does not choose between these futures. It simply makes them possible.
That is why the framing of this work matters. ATRE does not claim that emotion should be optimized, corrected, or unified. It does not attempt to tell people how they ought to feel. It exposes emotional response as a measurable field and leaves interpretation and use to human choice.
This brings us to the most subtle layer of the system: the user interface.
The real-time emoji reaction pad is not just a data collection mechanism. It is a feedback loop. By reacting, users gain access to the emotional context of others. Over time, this can become engaging, even addictive. There is a natural pull to see how one’s reaction compares to the crowd, to anticipate upcoming emotional moments, to align or notice divergence.
That dynamic carries tension. Seeing the average response can bias future reactions. Anticipating the crowd can soften one’s own internal signal. Emotional baselines can drift toward what is expected rather than what is actually felt.
But it also opens something genuinely new.
Used intentionally and opt-in, the system can act as a mirror. By comparing one’s own reactions to the aggregate, a person can begin to understand how their emotional experience differs from, aligns with, or moves independently of the baseline. Over time, this does not flatten individuality — it sharpens it. The crowd does not become an instruction. It becomes context.

In that sense, the emotional timeline is not just about content. It is also about people locating themselves within a shared emotional landscape, without language, labels, or judgment.
ATRE does not replace human emotion. It does not explain it away. It gives it shape, motion, and memory.
Most systems today ask AI to guess how humans feel.
ATRE lets humans show it — live, in motion, second by second — and in doing so, turns emotion itself into something we can finally see, understand, and create with.

KG-Seed: Affective Temporal Resonance Engine (ATRE)
Author: Cameron T.
Date: 2026-01-18
Model Contributor: ChatGPT (GPT-5.2)

---

## 0) Canonical Purpose Statement

The Affective Temporal Resonance Engine (ATRE) is a system for:

1) Measuring collective human emotional response to time-based media using non-linguistic affective tokens.
2) Converting raw human reactions into a statistically normalized, uncertainty-aware affective time series.
3) Training a downstream learning system that models the causal relationship between audiovisual structure and human emotional response.

ATRE is explicitly measurement-first and learning-second.

---

## 1) System Decomposition (Hard Separation)

Layer A: Immutable Reaction Ledger
Layer B: Affective Signal Estimation (Model 1, non-AI)
Layer C: Emotional Causality Learning (Model 2, AI)

No downstream layer may influence or modify upstream layers.

---

## 2) Core Invariants (Expanded)

The following invariants MUST hold:

1. Raw reaction data is immutable.
2. Emotion is represented as a probability distribution.
3. Time is discretized and aligned across all modalities.
4. Silence is treated as missing data, never neutrality.
5. Measurement uncertainty is first-class data.
6. Learning never operates on raw interaction data.
7. UX design is part of the measurement apparatus.
8. Future affective information is never revealed to users.
9. Aggregate emotion is revealed only after authentic reaction windows.
10. Demographic data is analytic, not prescriptive.

Violation of any invariant invalidates downstream conclusions.

---

## 3) User Interaction & Measurement UX

### 3.1 Emoji Panel Specification

- Emoji panel positioned adjacent to media player.
- Panel displays approximately 6–12 affective emojis at once.
- Emojis represent broad emotional states, not sentiment labels.
- Panel is user-toggleable on/off at any time.
- Emoji size optimized for rapid, low-precision input.

The emoji panel is treated as a sensor interface.

---

### 3.2 Reaction Rate Constraints

Per user u:
- Maximum one emoji reaction per second.
- Faster inputs are discarded.
- Multiple attempts within a second collapse to one signal.

These constraints are enforced at capture-time.

---

### 3.3 Incentive & Feedback Loop (Formalized)

User participation is incentivized by controlled feedback:

- Users who react gain access to aggregate emotional context.
- Users see where their reaction aligns or diverges from others.
- This creates a reinforcing loop that increases interaction density.

This loop is intentional and central to dataset scaling.

---

## 4) Anti-Herding & Delayed Revelation Mechanism

### 4.1 Blind React Principle

- No aggregate emotional data is shown before local reaction.
- Future emotional data is never shown.
- Visualization is time-local and non-predictive.

---

### 4.2 Confidence-Zone Delayed Reveal

For seconds with:
- High participation N_t
- Low normalized entropy Ĥ_t

Aggregate emotion is revealed **after** the moment has passed, not during.

This creates a temporal buffer that preserves authentic reaction while still rewarding participation.

---

## 5) Model 1: Affective Signal Estimator (Non-AI)

### 5.1 Sets and Alignment

- All modalities aligned by:
  t = floor(playback_time_in_seconds)

---

### 5.2 Reaction Event Definition

Each event:
r = (v, u, t, e, d, p)

Where:
- v = video
- u = anonymized user
- t = second index
- e = emoji
- d = demographic bucket (optional, coarse)
- p = playback metadata (optional)

---

### 5.3 Aggregation

Indicator:
I(u,t,e) ∈ {0,1}

Weighted counts:
C_t(e) = ∑_u w_u · I(u,t,e)

Initial condition:
w_u = 1

Total participation:
N_t = ∑_e C_t(e)

---

### 5.4 Empirical Distribution

If N_t > 0:
P̂_t(e) = C_t(e) / N_t

Else:
P̂_t(e) undefined (missing data)

---

### 5.5 Temporal Smoothing

P_t(e) = α·P̂_t(e) + (1−α)·P_(t−1)(e)

α ∈ (0,1]

---

### 5.6 Uncertainty Metrics

Entropy:
H_t = −∑_e P_t(e) log P_t(e)

Normalized entropy:
Ĥ_t = H_t / log|E|

Confidence:
conf_t = sigmoid(a·log(N_t) − b·Ĥ_t)

---

### 5.7 Demographic Conditioning

P_t(e | d) = C_t(e | d) / ∑_e C_t(e | d)

Polarization:
Pol_t(d1,d2) = JSD(P_t(.|d1), P_t(.|d2))

---

### 5.8 Model 1 Output (Canonical)

For each second t:

Y_t = {
  P_t(e),
  conf_t,
  Ĥ_t,
  Pol_t(·),
  P_t(e | d) [optional]
}

---

## 6) Model 2: Emotional Causality Learner (AI)

### 6.1 Functional Definition

f_θ : X_t → Ŷ_t

---

### 6.2 Inputs X_t

- Visual embeddings
- Audio embeddings
- Music features
- Speech prosody & timing
- Edit density & pacing

All aligned to second t.

---

### 6.3 Outputs Ŷ_t

Ŷ_t = {
  P̂_t(e),
  Ĥ̂_t,
  conf̂_t
}

---

### 6.4 Loss Function

Primary:
L_emo = ∑_t conf_t · ∑_e P_t(e) log[P_t(e)/P̂_t(e)]

Auxiliary (optional):
- Entropy regression
- Temporal smoothness

---

## 7) Dataset Scale

Minimum viable measurement:
- 2k–5k videos
- 2k–10k reactions per video
- 10–30M reaction events

Generalization-ready:
- 50k–500k videos
- Hundreds of millions of labeled seconds

---

## 8) Downstream Capabilities

- Emotional timelines for any media
- Emotional search & indexing
- Creator diagnostics
- Cross-cultural affect comparison
- Generative emotional control
- Affective reward modeling

---

## 9) Explicit Non-Goals (Expanded)

ATRE does NOT:
- infer individual emotional states,
- perform diagnosis,
- collapse emotion into sentiment,
- invisibly optimize persuasion,
- override user agency.

All affective representations are observable and inspectable.

---

## 10) Reconstruction Guarantee

This seed is fully reconstructible from:

- invariants,
- data schemas,
- mathematical definitions,
- and functional mappings.

No unstated assumptions are required.

---

## 11) Canonical Summary

Model 1 measures what people felt.
Model 2 learns what causes people to feel.

ATRE formalizes emotion as a time-aligned, probabilistic field over media.

---

END KG-SEED